- Boston: A Citywide Demographic Snapshot
- Immigration and Foreign-Born Residents in Boston
- Multidimensional Diversity
- Cultural and Civic Impact
- The Economic Landscape
- Neighborhoods With the Highest Shares of Immigrants
- Where Is Racial Diversity Concentrated?
- Housing Tenure and Who Can Stay
- The Impact of Boston’s Student Population
- Understanding Boston’s Diversity Beyond the Averages
Boston is often called a “city of neighborhoods,” and that is very much in evidence as the city’s demographics change. In recent decades, the city has become a majority-minority city, where no single racial or ethnic group constitutes an absolute majority.
Knowing where this variation exists across districts allows residents, urban planners, and newcomers to see beyond broad statistical averages and historic stereotypes.
To understand the modern Boston identity, you have to look at these localized changes in population. The North End and South Boston, neighborhoods steeped in history, have seen a gradual influx of diversity over time.
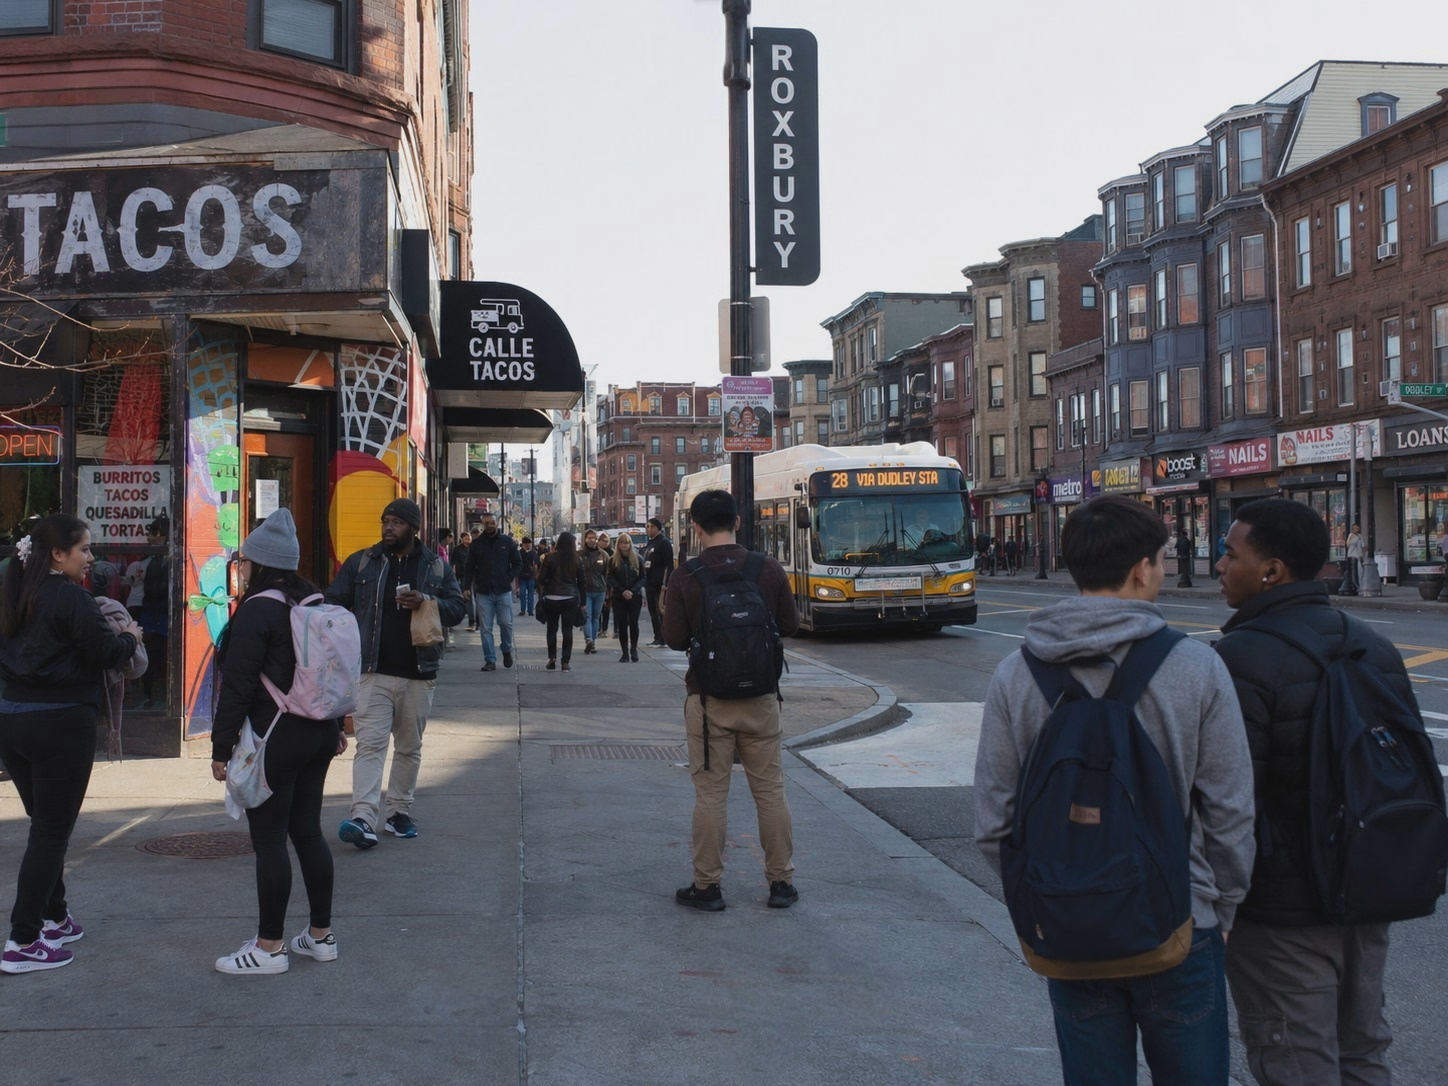
Neighborhoods like Dorchester, Roxbury, and East Boston have also continued to serve as cultural hubs for many immigrant and minority populations. This localized diversity directly supports the city’s cultural framework and local work force.
Government officials and community leaders can recognize the distinct demographic profile of each specific area, thus better allocating resources, responding to neighborhood-specific needs and fostering inclusive growth across the entire city.
Boston: A Citywide Demographic Snapshot
Data from the most recent American Community Survey paints a picture of a municipality of complex and layered diversity. These numbers are an important starting point for understanding the current civic identity of Boston, in which the population is spread across a handful of broad racial and ethnic categories:
- Hispanic or Latino (of any race): 18.94% (about 125,767 residents)
- Not Hispanic or Latino: 81.06% (538,205 people)
- Black or African American: 21.54% (about 143,024 residents)
- Asian: Approximately 9% of the total population
- Non-Hispanic White: 54.88% of the non-Hispanic population (approximately 295,342 people)
Boston officially became a majority-minority city around the year 2000, and that reality has only strengthened over the past two decades. The change is ongoing, largely due to steady international immigration and the constant influx of students and professionals attracted to the city’s universities and medical fields.
The data also challenges older historical stereotypes about the makeup of the city’s European population. Today, no single ancestry is the dominant majority even among the white population. Irish ancestry is claimed by just under 13% of the total population, amounting to about 83,000 individuals. This makes them the largest single ethnic group in the area, but they are still far from an absolute majority.
Instead, the Boston of today is a remarkably diverse patchwork of communities, where the growing presence of Dominicans, Cape Verdeans, Chinese, and Haitians is actively reshaping the cultural and economic landscape of the city’s neighborhoods.
Immigration and Foreign-Born Residents in Boston
Boston’s population diversity is largely a result of continued immigration, keeping it in its historic role as a major American port of entry. Today, more than a quarter of the city’s population is foreign born. The community brings a wealth of cultural traditions, languages, and world views to the municipality.
The residents come from all over the globe and are concentrated in distinct regional clusters:
- About half of Boston’s foreign born population is from countries across Latin America and the Caribbean.
- About one quarter of the immigrant population is from different countries in Asia.
- The rest of the population is mainly made up of people from Europe and Africa, in line with both historical and more recent migration routes.
Multidimensional Diversity
When we look inside the immigrant population, the racial and ethnic breakdown shows that modern diversity is multidimensional in a deep way.
Boston’s foreign-born population is highly diverse rather than a single demographic group, which makes the social fabric of the city more complex. Internally, the demographic composition is relatively balanced across the main groups:
- Hispanic or Latino: 29.5% of the foreign-born population.
- Black or African American: 25.5% of the foreign born population, including large diaspora communities.
- Asian or Pacific Islander: 24.6% of the foreign born population.
Cultural and Civic Impact
At the national level, the three most common countries of origin for Boston’s immigrants are the Dominican Republic, China, and Haiti. The concentrated presence of these communities directly influences the cultural identity of neighborhoods such as East Boston, Chinatown, and Mattapan.
Spanish is still the most widely spoken language at home other than English. This widespread use has a direct impact on everyday municipal operations and public infrastructure. For example, the city government often updates its public transit notifications, voting materials, and neighborhood health center resources to accommodate bilingual residents.
In addition, Boston Public Schools spend heavily on multilingual instruction and specialized support services to help new immigrant families navigate the school enrollment process.
The Economic Landscape
Boston’s foreign born population works in every sector of the city’s economy, from the most basic industries to the highest levels of the professional and technical professions. However, their distributions differ strikingly from those of native-born residents.
The employment patterns are clear in the occupational data:
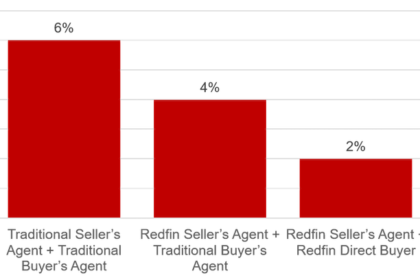
- Service Occupations: 24.5% of foreign-born workers are employed in service occupations, compared to 12.9% of native-born workers. Often the backbone of Boston’s hospitality, food service and auxiliary health care industries.
- Managerial and Professional Occupations: 23.9% of the foreign born residents are in professional occupations compared with 34.2% of the native born residents. Many of these workers are highly skilled professionals who work in the city’s world-renowned biotechnology, higher education and financial institutions.
This statistical division highlights the two-sided character of the current Boston labor market. The research shows that Boston remains a place of high economic mobility and job opportunities for international newcomers.
However, the stark differences in job titles indicate ongoing structural barriers, credential recognition issues, and socioeconomic inequities.
Urban planners, local businesses, and community advocates must keep working to close these gaps so that economic growth is inclusive of all Boston residents, regardless of their country of origin.
Neighborhoods With the Highest Shares of Immigrants
Boston’s immigrant populations are not spread evenly across the city, but tend to be concentrated in a few neighborhoods with very high concentrations of foreign born residents.
These demographic hubs are essential to the development of the city’s civic identity as a whole:
- Chinatown: Some 51 percent of the population here was born outside the United States and is mostly of Asian descent. The neighborhood has been one of the city’s most resilient cultural anchors for generations, providing essential services, family associations, and legacy businesses. However, this densely populated district is also currently undergoing intense gentrification and is experiencing some of the highest housing cost pressures and displacement risks in the metropolitan area.
- East Boston: Some 45 percent of the people here are foreign born. Today, the population is overwhelmingly Latino, with deep, established roots in the Colombian, Salvadoran, and other Central American communities. This contemporary cultural landscape sits next to the historic legacy of earlier waves of Italian and East European immigration, creating a vibrant waterfront neighborhood with a diverse culinary scene and a booming local economy.
- Allston, Downtown, Mattapan, and Dorchester: More than a third of the residents in each of these districts were born outside the United States. This targeted immigration directly supports a range of commercial corridors, dynamic religious institutions, and vital neighborhood organizations. Dorchester and Mattapan, for example, are regional centers for the Caribbean and Cape Verdean diasporas, and Allston is a perennial hangout for international students and young professionals.
If you are thinking about moving to the area, it is important to know this local context. Understanding how global immigration and differing cultural histories actively shape neighbourhood institutions, public schools and small businesses is often just as important as comparing average rent prices or assessing daily commute times.
By knowing these demographic realities, new arrivals can make better housing choices and be more engaged with their environment. This kind of local knowledge is especially useful in working with Boston local movers to get successfully settled in a new part of town.
Where Is Racial Diversity Concentrated?
While Boston has a reputation as a diverse, international city, the reality is often more complicated: many of its neighborhoods are still racially and economically segregated.
The citywide numbers clearly show a majority minority population, but the distribution of the city block by block tells a different story of historical dividing lines, uneven economic development, and modern housing policies.
To understand this geographical division is to understand the real social life of the city today.
- Dorchester: Dorchester, with a population of over 126,000 residents or about one-fifth of the city’s total population, is often touted as Boston’s most diverse neighborhood. It’s almost a city within a city with large Black, Latino, Asian, and white populations. The area is anchored by large established Cape Verdean, Vietnamese, and Caribbean communities. Fields Corner is one example of this multicultural vibrancy: a dense web of immigrant-run businesses, neighborhood restaurants, and community service organizations along commercial corridors.
- Mattapan: Approximately 92% of Mattapan residents are people of color, with roughly 70% identifying as Black. The neighborhood has very deep Caribbean and Haitian roots, very evident in the local commerce and civic life in the neighborhood, especially around Mattapan Square. Mattapan also has a large number of Black homeowners and is a critical neighborhood for generational wealth-building and neighborhood stability in Boston’s communities of color.
- Roxbury: Estimated to have a population of 50,000, Roxbury has long been considered the cultural, social, and political center of Black Boston. The neighborhood, rich in civil rights activism history, is centered around commercial and transit hubs like Nubian Square. The makeup of the area today is still changing as the Latino and newer immigrant populations increase. Here, city leaders are trying to find a balance between welcoming new economic development and anti-displacement policies that protect longtime residents.
- Beacon Hill and the Seaport: By comparison, neighborhoods like Beacon Hill and the Seaport remain more than 80 percent white and some of the most racially homogenous parts of the city. Beacon Hill is a historic neighborhood with generational wealth, kept alive by strict historic zoning and incredibly high property values. The Seaport, on the other hand, is a new, high end waterfront development. In both districts, prohibitively high housing costs and very limited availability of family size units effectively exclude many middle and lower income working families, perpetuating distinct racial and economic isolation.
- Bay Village: Bay Village is one of Boston’s smallest officially recognized neighborhoods, with a population of around 1,600. Tucked snugly between the South End, Back Bay, and Chinatown, its small historic housing stock and tiny geographic footprint make for a one of a kind dynamic. The community is so small that any demographic or economic changes are immediately visible. A small shift in the absolute numbers of residents or property turnovers can greatly change the statistical profile of this close knit district.
Housing Tenure and Who Can Stay
Housing tenure, especially the mix of renting and owning, is a key determinant of the diversity, economic stability, and long term demographic trends of Boston’s neighborhoods.
The type of housing stock available has a direct bearing on who can afford to settle and who will be forced out in the end.
- Chinatown: This neighborhood has the greatest concentration of renters of any area of the city, with more than 90% of housing units occupied by renters. Because homeownership is so rare here, long time residents are particularly vulnerable to market-rate rent increases, luxury redevelopment, and displacement. In an era of rising real estate prices, the neighborhood’s cultural fabric is largely sustained by subsidized housing and community land trusts.
- Allston and Fenway: These districts are also overwhelmingly renter heavy, but for very different reasons. The housing markets here are dominated largely by huge student demand from local universities and young professionals looking for smaller, multi-unit apartment buildings. The constant influx of temporary residents leads to high rental turnover and often prevents the formation of long-term civic ties.
- Hyde Park and West Roxbury: By stark contrast, the percentage of renters in these suburban-style neighborhoods is at or below 40%. The housing stock consists of single family homes and a high percentage of long term homeowners. This dynamic produces a lot of community stability and civic engagement, but also large financial barriers. The high costs of purchasing a home make it difficult for lower income families or new immigrants to buy in these areas.
In the end, it is these neighborhood-level real estate dynamics that dictate the pace of change in the city. Neighborhoods with a high share of renters will tend to see faster demographic change as people move in and out as leases expire and affordability shifts.
Neighborhoods with a high rate of homeownership tend to change much more slowly. This slower pace of change overall preserves community wealth, but it can also inadvertently reinforce historical patterns of racial and economic segregation.
The Impact of Boston’s Student Population
Having so many colleges and universities complicates the demographic picture of Boston. The institutions have a material impact on local housing markets and neighborhood data. It is estimated that two thirds of the total college student population live off campus.
This steady stream of students is driving local trends:
- Fenway and Longwood: These areas are populated by an abundance of undergraduate students, graduate researchers, and young medical professionals. Most of these people are tied to specific academic or residency periods, and the population turnover in the area is rapid. That means the local economy is geared to short term renters, which makes for a transient but lively community.
- Allston, Mission Hill, and Brighton: In these districts, a young, highly transient population is created by large numbers of students living off campus. However, these students do not exist in isolation. They are neighbors to longstanding immigrant communities, working class residents, and multi generational family households. Communal geography of this sort often leads to fierce competition for rental units, which can push up housing costs and reduce space for permanent residents.
In these neighborhoods, the concept of diversity is far broader than the usual metrics of race and ethnicity. It deliberately includes a wide spread of life stages, education levels, and very different lengths of neighborhood residence.
Thus, city planners and neighborhood advocates must constantly negotiate the immediate needs of these temporary academic populations against the crucial preservation of long term community stability.
Understanding Boston’s Diversity Beyond the Averages
While statistical reports rightly label Boston a majority minority city with deep immigrant roots, the lived geography of its residents paints a more intricate picture. From a citywide viewpoint, the demographic data suggest a thoroughly integrated population. But a block by block look at the city reveals racial and economic disparities remain.
Some neighborhoods, such as Dorchester and East Boston, are remarkably diverse cultural melting pots where residents of Latin American, Caribbean, Asian and European descent often share common ground. Newer neighborhoods such as the Seaport and historic enclaves like Beacon Hill, by contrast, remain overwhelmingly white and wealthy.
The stark differences between neighborhoods underscore the economic barriers and historical housing practices that continue to drive demographic divides in a city that prides itself on being progressive.
Being able to recognize these long-lasting spatial trends is a critical first step for urban planners working on equitable public policy, civic leaders who are active in community advocacy, and prospective residents choosing where to settle down.
Having an accurate picture of Boston’s population gives stakeholders the ability to move beyond broad generalizations and focus on specific, localized issues from housing affordability and transit access to neighborhood resource allocation. In the end, Boston’s diversity is too complex to be reduced to any single narrative. It is, rather, a dynamic, ever shifting mosaic.


