
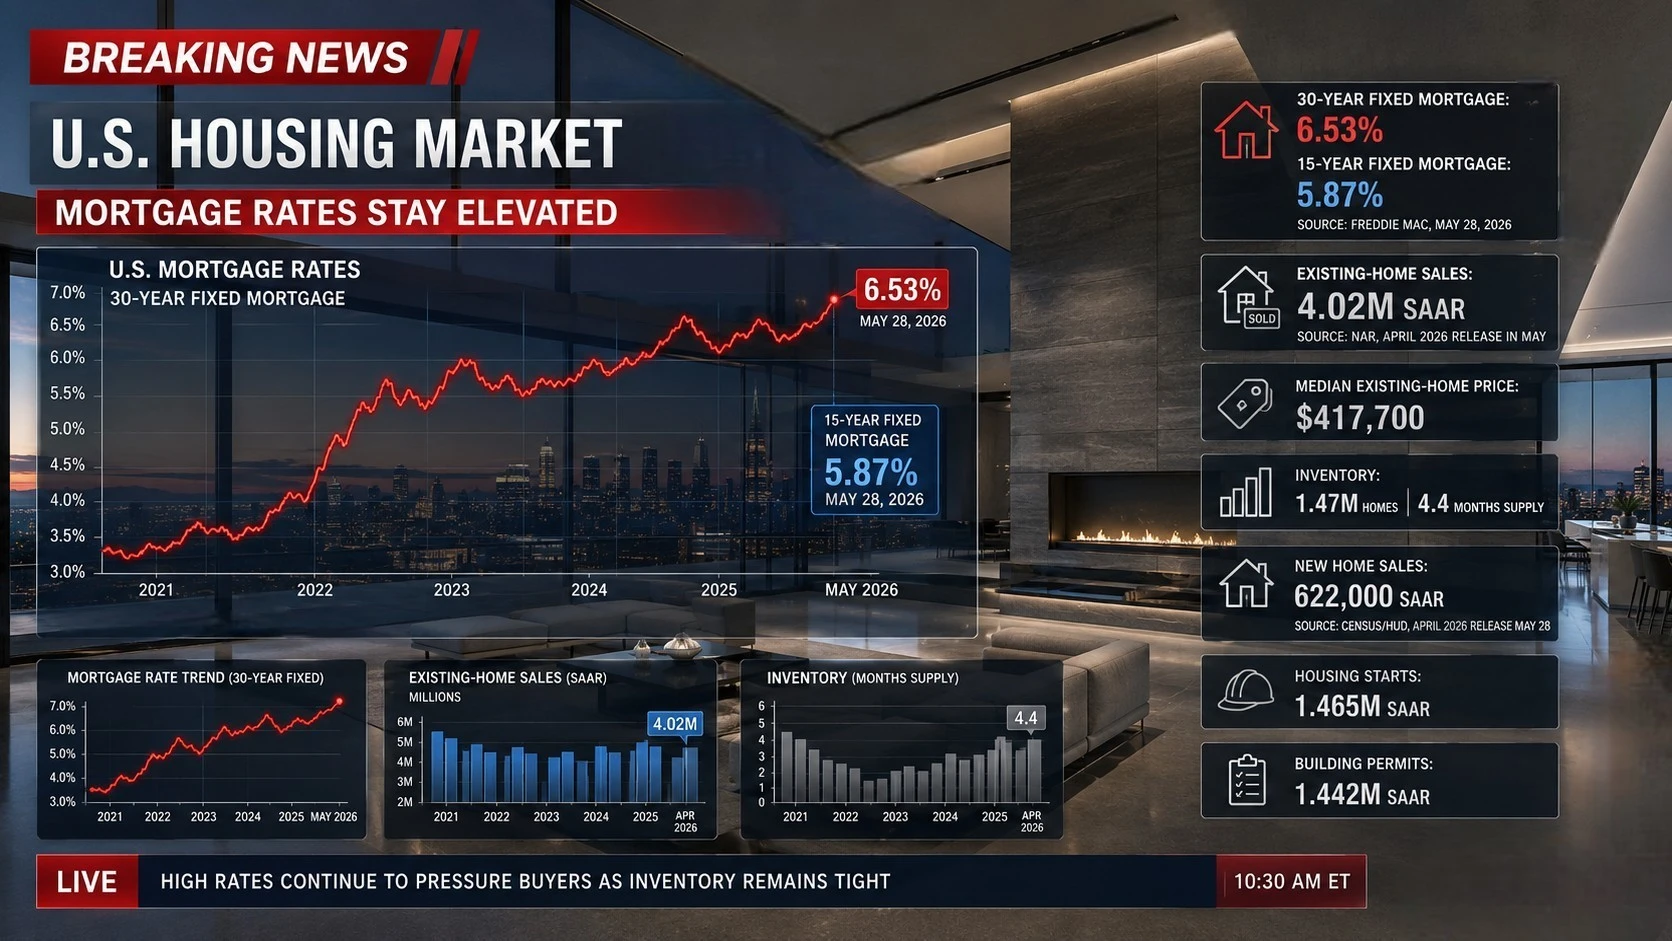
Mortgage rates have climbed to their highest level in nine months, adding fresh pressure to an already strained U.S. housing market. The average rate on a 30-year fixed mortgage rose to 6.53% as of May 28, 2026, while the average 15-year fixed rate increased to 5.87%.
The pressure is starting to show up in mortgage demand, especially among homeowners looking to refinance. Mortgage applications fell 8.5% in the week ending May 22, as the average contract rate for a standard 30-year fixed loan rose to 6.65%. Refinance applications dropped 18%, while purchase applications slipped just 0.4%, suggesting buyers have pulled back only slightly even as borrowing costs have moved higher.
Inflation remains one of the main forces keeping mortgage rates elevated. The Consumer Price Index rose 3.8% in the 12 months ending in April, with energy prices up 17.9% and gasoline prices surging 28.4%.
The current economic uncertainty is being fueled by the U.S.-Israeli military operation against Iran launched on February 28, 2026. The U.S. Energy Information Administration said global oil markets are facing heightened volatility because of the de facto closure of the Strait of Hormuz, a key transit route that carried nearly 20% of global oil supply before the conflict.
That leaves the Federal Reserve in a difficult position. In April, policymakers kept the federal funds rate target range at 3.5% to 3.75% and reiterated their commitment to bringing inflation back to the Fed’s 2% goal.
For the housing market, the Fed’s stance cuts both ways. Higher interest rates can help slow inflation, but they also make monthly mortgage payments more expensive and push some would-be buyers to the sidelines. Lower rates would improve affordability and could bring more buyers back into the market, but they could also risk adding more fuel to inflation.
The latest housing data points to a market under pressure, but not one in free fall. Existing-home sales rose just 0.2% in April. Inventory increased to 1.47 million homes, equal to a 4.4-month supply, while the median existing-home sales price rose 0.9% from a year earlier to $417,700.
Listings are also building. Realtor.com reported that active listings rose 4.6% year over year in April, while the national median list price fell 1.4% to $425,000. Price cuts are becoming more common as well, with 16.7% of active listings seeing reductions. Those cuts were more widespread in the South and West than in the Midwest and Northeast.
Redfin’s data showed a similar pattern. The brokerage reported that 35.4% of U.S. home sellers cut their asking prices in April. In San Antonio, Austin, Phoenix, and Dallas, more than half of sellers lowered their prices.
Concerns about a housing market crash have not gone away, but the current data still do not suggest a repeat of 2008. ATTOM reported that 42,430 U.S. properties had a foreclosure filing in April, up 18% from a year earlier. Even so, foreclosure activity remained well below pre-pandemic levels.
Homeowner equity is also cooling, though it remains relatively strong at the national level. In the first quarter, 43.3% of mortgaged homes were equity-rich, while 3.2% were seriously underwater, meaning the loan balance was at least 25% higher than the property’s estimated market value.
Taken together, the data points to a housing market that is becoming more fragile, especially in parts of the South and West where inventory is rising and price cuts are spreading. But for now, the stress looks more like a gradual correction than the start of a nationwide collapse.